Use this file to discover all available pages before exploring further.
fal apps run on standard Python, so you can instrument them with the OpenTelemetry SDK the same way you would any other service. Add the SDK to requirements, initialize a tracer in setup(), and wrap your inference stages with spans. For custom metrics instrumentation, see Custom Metrics. For tracing across multiple fal apps, see Cross-Service Tracing.
Store your credentials as fal secrets so they are available as environment variables on the runner without being embedded in your code.
Datadog (US)
Datadog (EU)
New Relic (US)
New Relic (EU)
Grafana Cloud
Honeycomb
fal secrets set OTEL_EXPORTER_OTLP_ENDPOINT=https://otlp.datadoghq.comfal secrets set OTEL_EXPORTER_OTLP_HEADERS="dd-api-key=<YOUR_API_KEY>"
fal secrets set OTEL_EXPORTER_OTLP_ENDPOINT=https://otlp.datadoghq.eufal secrets set OTEL_EXPORTER_OTLP_HEADERS="dd-api-key=<YOUR_API_KEY>"
fal secrets set OTEL_EXPORTER_OTLP_ENDPOINT=https://otlp.nr-data.net:4318fal secrets set OTEL_EXPORTER_OTLP_HEADERS="api-key=<YOUR_LICENSE_KEY>"
fal secrets set OTEL_EXPORTER_OTLP_ENDPOINT=https://otlp.eu01.nr-data.net:4318fal secrets set OTEL_EXPORTER_OTLP_HEADERS="api-key=<YOUR_LICENSE_KEY>"
fal secrets set OTEL_EXPORTER_OTLP_ENDPOINT=https://otlp-gateway-prod-<region>.grafana.net/otlpfal secrets set OTEL_EXPORTER_OTLP_HEADERS="Authorization=Basic <base64(instanceId:token)>"
fal secrets set OTEL_EXPORTER_OTLP_ENDPOINT=https://api.honeycomb.iofal secrets set OTEL_EXPORTER_OTLP_HEADERS="x-honeycomb-team=<YOUR_API_KEY>"
Add opentelemetry-sdk and opentelemetry-exporter-otlp-proto-http to your app’s requirements. The exporter reads OTEL_EXPORTER_OTLP_ENDPOINT and OTEL_EXPORTER_OTLP_HEADERS from the environment automatically, no endpoint or auth code required.Initialize the tracer in setup(). The provider and export connection are created once per runner, not once per request.The example below builds on the Stable Diffusion XL quickstart and adds spans around each stage of a text-to-image request.
Python
import osimport falfrom fal.toolkit import Imagefrom pydantic import BaseModel, Fielddef setup_tracer(service_name: str): from opentelemetry import trace from opentelemetry.exporter.otlp.proto.http.trace_exporter import OTLPSpanExporter from opentelemetry.sdk.resources import Resource from opentelemetry.sdk.trace import TracerProvider from opentelemetry.sdk.trace.export import BatchSpanProcessor resource = Resource.create({"service.name": service_name}) provider = TracerProvider(resource=resource) provider.add_span_processor(BatchSpanProcessor(OTLPSpanExporter())) trace.set_tracer_provider(provider) return trace.get_tracer(service_name), providerclass Input(BaseModel): prompt: str = Field(description="The prompt to generate an image from") num_inference_steps: int = Field(default=20)class Output(BaseModel): image: Image trace_id: strclass TextToImageApp(fal.App): machine_type = "GPU-H100" requirements = [ "hf-transfer==0.1.9", "diffusers[torch]==0.32.2", "torch==2.10.0", "transformers[sentencepiece]==4.51.0", "accelerate==1.6.0", "opentelemetry-sdk==1.41.0", "opentelemetry-exporter-otlp-proto-http==1.41.0", ] def setup(self): # Enable HF Transfer for faster downloads os.environ["HF_HUB_ENABLE_HF_TRANSFER"] = "1" import torch from diffusers import StableDiffusionXLPipeline self.tracer, self.tracer_provider = setup_tracer("text-to-image") self.pipe = StableDiffusionXLPipeline.from_pretrained( "stabilityai/stable-diffusion-xl-base-1.0", torch_dtype=torch.float16, variant="fp16", use_safetensors=True, ).to("cuda") # Warmup runs once per runner at startup - not per request. # It compiles CUDA kernels so the first real request does not pay that cost. with self.tracer.start_as_current_span("warmup") as span: span.set_attribute("model.name", "stable-diffusion-xl-base-1.0") self.pipe("warmup") @fal.endpoint("/") def run(self, input: Input) -> Output: with self.tracer.start_as_current_span("text-to-image") as root: root.set_attribute("model.name", "stable-diffusion-xl-base-1.0") root.set_attribute("prompt.length", len(input.prompt)) root.set_attribute("num_inference_steps", input.num_inference_steps) with self.tracer.start_as_current_span("inference") as span: span.set_attribute("num_inference_steps", input.num_inference_steps) result = self.pipe( input.prompt, num_inference_steps=input.num_inference_steps, ) with self.tracer.start_as_current_span("upload"): image = Image.from_pil(result.images[0]) trace_id = format(root.get_span_context().trace_id, "032x") return Output(image=image, trace_id=trace_id) def teardown(self): # Flush buffered spans before SIGKILL (5s grace period). # For sampling, batch tuning, and conditional tracing see Production Configuration. if self.tracer_provider: self.tracer_provider.force_flush(timeout_millis=4000)
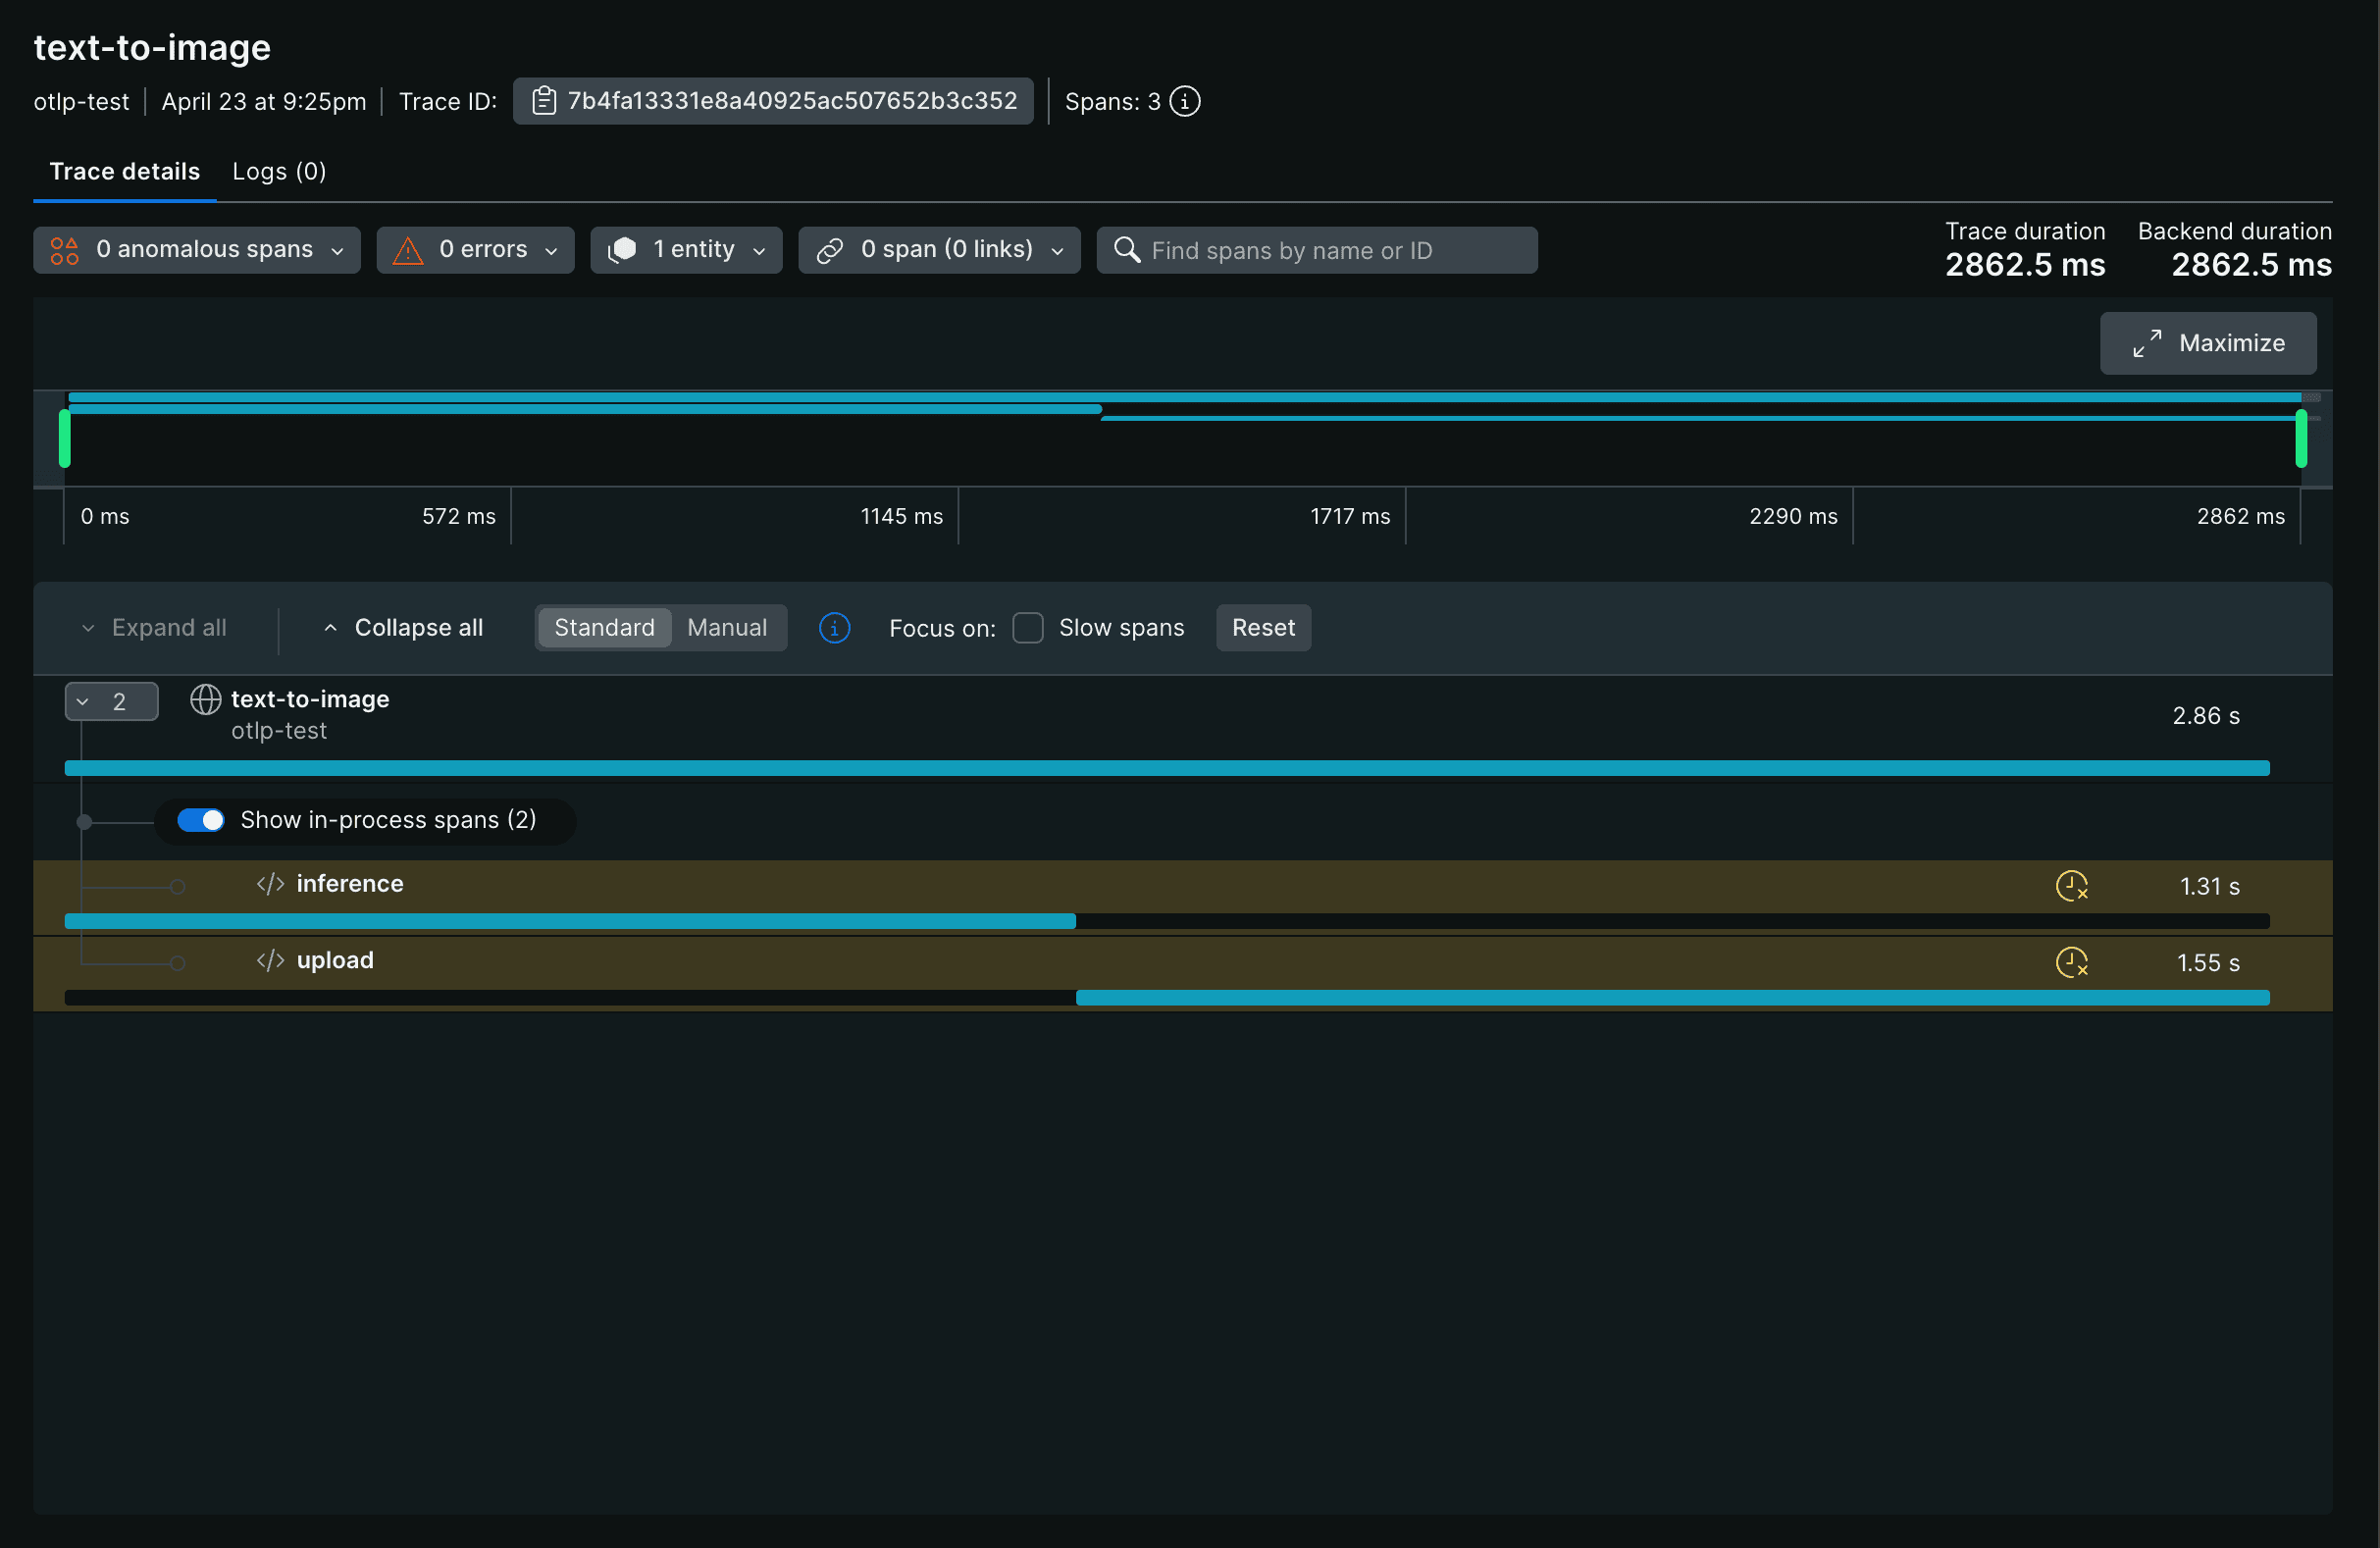
The example above produces a tree of spans under a single root:
text-to-image├── inference└── upload
The warmup span appears in your backend attached to the runner’s startup trace, not to individual requests. Each request produces its own text-to-image root span. The parent span’s duration covers all of its children, so text-to-image reflects the total request time including upload.The trace appears in your backend like this, with inference and upload shown as timed children of the root span:
Call span.set_attribute(key, value) to attach metadata to a span. Attributes appear as filterable fields in your backend’s trace viewer, so you can search for all traces where num_inference_steps is above a threshold or prompt.length exceeds a limit.
Python
with self.tracer.start_as_current_span("inference") as span: span.set_attribute("model.name", "stable-diffusion-xl-base-1.0") span.set_attribute("num_inference_steps", input.num_inference_steps) span.set_attribute("prompt.length", len(input.prompt)) span.set_attribute("guidance_scale", 7.5)
Attribute keys follow the OpenTelemetry semantic conventions where applicable. For model-specific attributes, use a consistent namespace like model.* or inference.*.
Use record_exception and set_status to mark a span as failed. This is the portable OpenTelemetry pattern — all OTLP backends interpret StatusCode.ERROR as a failed span, whereas a custom error attribute is backend-specific metadata.
Python
from opentelemetry.trace import Status, StatusCodewith self.tracer.start_as_current_span("inference") as span: try: result = self.pipe(input.prompt) except RuntimeError as e: span.record_exception(e) span.set_status(Status(StatusCode.ERROR, str(e))) raise
BatchSpanProcessor exports spans asynchronously in the background. On a long-running runner, spans are batched and exported on a schedule. On shutdown, spans still in the buffer are flushed in teardown(). See Production Configuration for how to configure this flush.